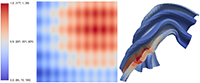
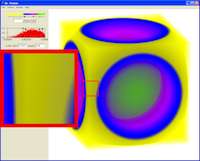
When representing numeric values as colors, the choice of color has a dramatic
affect on the interpretation back to numbers. This work collects a series of
color ranges that are known to have good properties when mapping scalar fields
to colors. Use this as a reference when creating scientific visualizations.

A common practice in studying the scaling performance of large scale parallel
algorithms is to look at the behavior of the running time as the number of
processing elements changes. This is a very poor way to analyze scaling behavior
as good scaling and bad scaling can be visually indistinguishable from each
other. This paper demonstrates the problems with using running time to study
scaling and describes other metrics, easily derived from running time, that do a
much better job characterizing scaling performance.
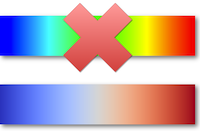
Designing the appropriate mapping from values to colors requires a mix of
expertise in visualization, color, and perception. Most visualization users and
many visualization experts lack the necessary background to design effective
color maps. Consequently, many visualizations default to a color map infamous
for its ineffectiveness: the rainbow color map. This work provides a method to
easily generate a continuum of colors that yield effective and perceptually
correct color mapping. In particular, the provided cool to warm color map makes
for a good general default color map.
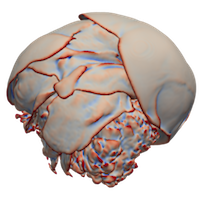
As accelerator processors such as GPUs become more prevalent in HPC, the need
for running visualization algorithms that process and generate mesh topologies
using massive amounts of execution threads becomes ever more pressing. Breaking
a mesh into constituent elements to feed input of these threads is
straightforward. However, many algorithms require the coordination and
combination of results generated in disparate threads. This work provides the
basic programming pattern that can be applied to numerous such algorithms. This
critical technique is demonstrated on a variety of algorithms including marching
cubes, subdivision, and dual grid generation.
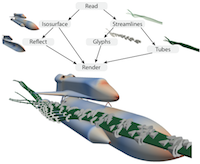
The most common abstraction used by visualization libraries and applications
today is what is known as the visualization pipeline. The visualization pipeline
provides a mechanism to encapsulate algorithms and then couple them together in
a variety of ways. The visualization pipeline has been in existence for over
twenty years, and over this time many variations and improvements have been
proposed. This paper provides a literature review of the most prevalent features
of visualization pipelines and some of the most recent research directions.
In this work we demonstrate running the scalable rendering library IceT at
scale on a large supercomputer. Along the way we introduce several simple to
implement but powerful sort-last parallel rendering modifications that greatly
improve the efficiency including minimal copy image interlacing for better load
balancing and telescoping compositing for arbitrary job sizes. Visit the IceT
project page for access to the software, documentation, and further papers and
information on scalable rendering.
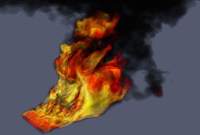
This is, to the best of my knowledge, the first publication describing
implementing the Fast Fourier Transform algorithm on a modern graphics
processor. The work predates general GPU languages like CUDA and OpenCL, so this
implementation uses an older shader language called Cg. Since this paper there
have been many improved implementations of the FFT algorithm, but the paper
still provides some index manipulations and real transform symmetry encoding
that can be useful.
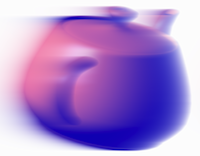
Partial Pre-Integration is a technique to accelerate the radiative transfer
computation used in volume rendering. The technique simplifies the complicated
equations by collecting integrands with like parameters and evaluating them with
universally applicable tables. (Note that Partial Pre-Integration is not the
same as Pre-Integration, which precomputes all possible integrals in a
parameter-specific table.)